
Guess the Grade
The Problem
At the time of writing, I've been regularly rock climbing for about four years now. I'm always trying to push my climbing to the next level, which has slowly lead me to more structured and consistent training. In this journey, I've found that system boards are an important training tool to develop the body tension needed for hard climbing. System boards are short walls with fixed holds, often with adjustable steepness. The climber can connect to the board via a dedicated app containing a database of climbs set by the community. Selecting a climb illuminates a set of LED lights indicating which holds on the wall can be used in an attempt to reach the top of the wall. A single system board can have tens of thousands of climbs/boulder, all with a floor footprint of just a single climb.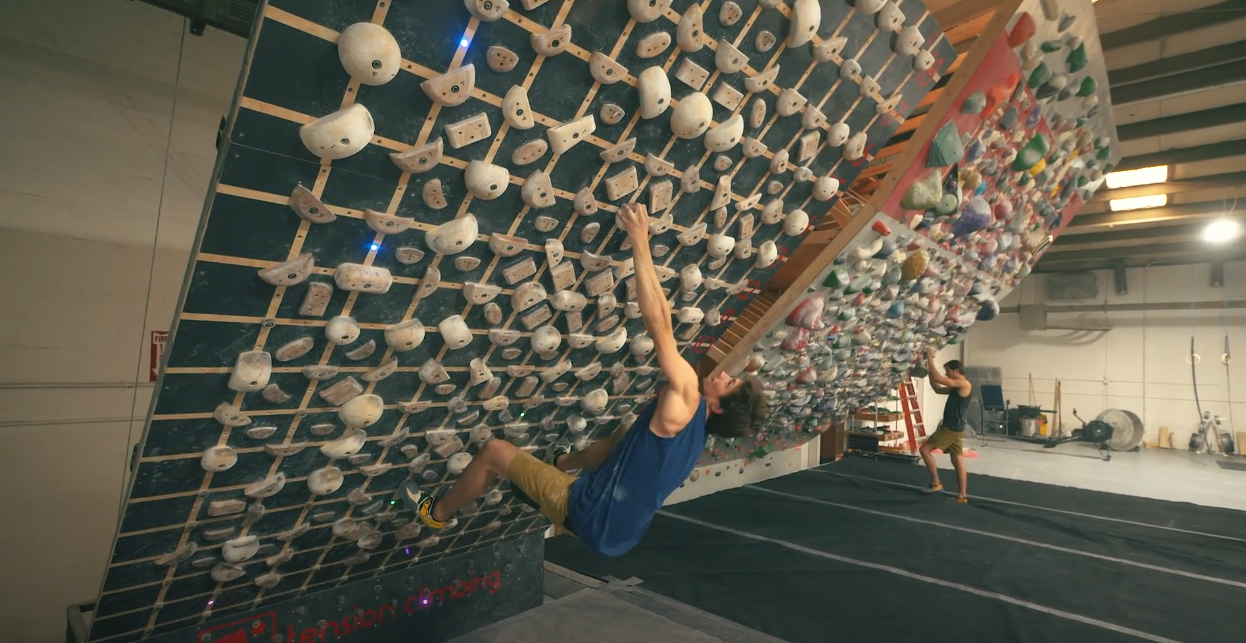
Accurate, automatic boulder grading would help tens of thousands of climbers select training climbs appropriate to their skill level. This begs the question---can a machine learning (ML) model be trained to predict the difficulty of a boulder on a system board?
The Data
The first step to training an ML model is always obtaining a database for training and testing the model. Fortunately, SQLite databases containing all of the climbs on a variety of system boards can be obtained straightforwardly using the BoardLib library.Here, we'll focus on building a model for the Tension Board 1 (TB1), the board at my gym that I have the most experience with. The TB1 can be constructed with varying sets of holds, resulting in several different layouts, each encoded as an integer. After some examination, I've found my gym uses layout 9, which also seems to be the most popular and complete layout. Additionally, we'll also limit ourselves to single boulders, rather than circuits consisting of long sequences of moves. This translates to selecting climbs only with the variable 'frames_count' set to 1.
With these restrictions, we can now query the database to select the data we're interested in using for model training and testing. This information is stored within three tables that needs to be joined with some light manipulation. We'll start with a simple 'SELECT' query from the 'climbs' table:
SELECT
        uuid,
        name,
        frames,
        stats.angle,
        INSTR(LOWER(description), 'no match') > 0 AS no_match,
        v_scale.v_grade,
        stats.ascensionist_count,
        stats.quality_average
FROM climbs
The uuid, name, and frames fields contain a climb ID (unique up to the angle of the wall), name of the climb, and holds used in the climb, respectively.
In climbing, matching refers to whether or not you are allowed to place both hands on a hold simultaneously.
Some boulders are set with matching in mind, others are set explicitly prohibiting matching.
In the app, those that prohib matching are found by searching the description for the phrase 'no match'; we do the same here to determine if matching is allowed for each climb.
The board angle, difficulty, number of ascensionists, and the community-determined quality will be pulled from joined tables (aliased as 'stats' and 'v_scale'), described below, starting with the 'stats' table.
JOIN (
        (SELECT
                climb_uuid,
                angle,
                display_difficulty,
                ascensionist_count,
                quality_average
        FROM climb_stats
        ) as 'stats'
This fragment of the query selects the climb ID and corresponding angle, difficulty, number of ascensionists, and quality from the 'climb_stats' table and aliases that table as simple 'stats'.
This table is eventually joined on each climb's uuid with the above columns selected from the 'climbs' table.
Before that, we need to process the display difficulty.
The difficulty of each climb is stored as a float which is then rounded and mapped to a given grade.
This allows the app to display climb difficulties on different grading scales, depending on the climber's preferences and where they are in the world (Europe tends to use the Font-Scale, for example).
We query table matching these difficulty values to the grading scale and join it with the 'stats' table as so,
        JOIN (
                SELECT
                        difficulty,
                        SUBSTR(boulder_name, INSTR(boulder_name, 'V') + 1, LENGTH(boulder_name)) AS v_grade
                FROM difficulty_grades
                ) as 'v_scale'
        ON ROUND(stats.display_difficulty, 0) = v_scale.difficulty
        )
        ON climbs.uuid = stats.climb_uuid
        AND frames_count = 1
        AND layout_id = 9;
The fourth line in the above sub-query does some string manipulation to extract the V grade name, which is stored in the same column as the Font-Scale grade name for some reason.
In effect, this 'JOIN' adds a column with the V grade name alongside the corresponding display difficulty floats.
This table is this joined with the original 'climbs' table query along the 'uuid' and 'climb_uuid' columns (for the 'climbs' and 'stats' tables, respectively), selecting only the boulders matching the desired layout as described above.
With this data in hand, we can further investigate the 'frames' column of our resulting data. This column contains a string that indicates which holds are 'on' and the allowed uses for each hold. For example, each boulder must have a start and finishing hold, and holds can be indicated as general use or a foot hold only. The most climbed boulder has the following 'frames' entry: 'p22r1p49r1p74r2p76r4p78r2p80r2p82r3'. The 'p' string indicates that the following number is the number of the hold on the wall, while the 'r' string indicates the preceeding hold's intended use. Starting with the hold's use, the numbers 1-4 correspond to a start, middle, finish, and foot hold, respectively.
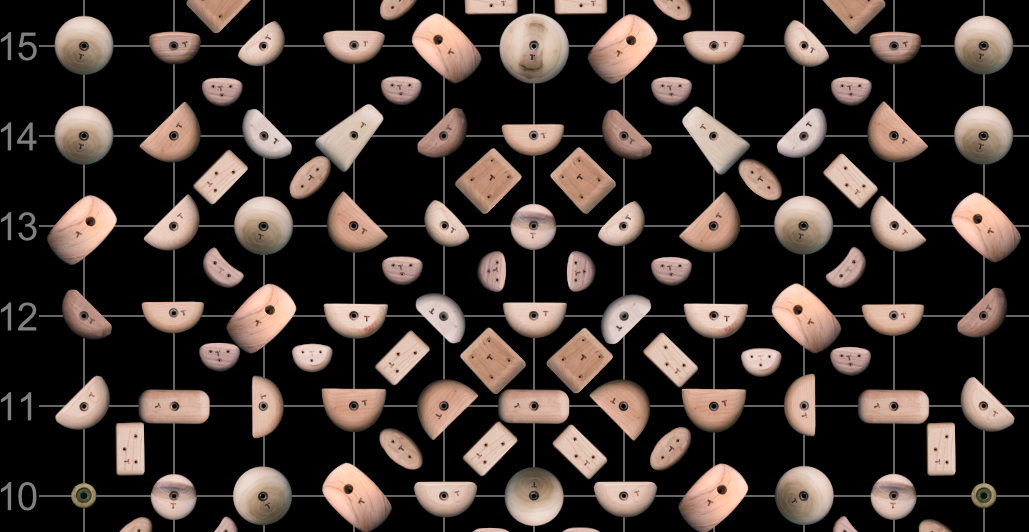
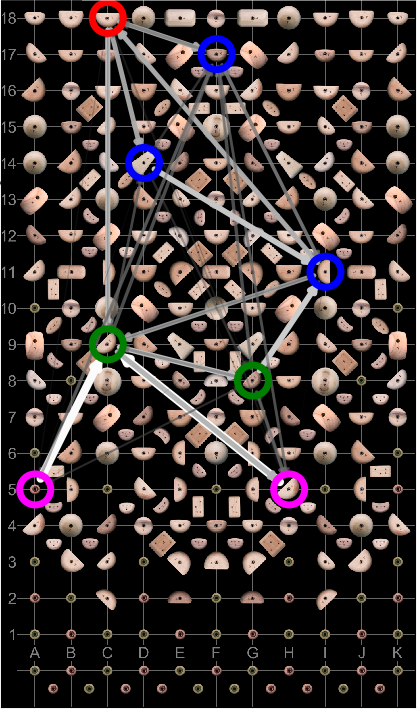
Of course, it's more informative to know where the holds are on the wall instead of each hold ID. This information is contained within two tables: the first maps the hold ID to a hole ID corresponding to the bolt hole that is used to attach the hold to the wall, while the second maps each hole ID to cartesian coordinates. To further complicate things, the TB1 is designed such that holds are mirror images of each other on the right and left sides of the board, as seen in the following photo.
SELECT placements.id, x, y, xm, ym FROM placements
JOIN
        (
        SELECT
                h1.id,
                h1.x,
                h1.y,
                h1.mirrored_hole_id,
                h2.x as xm,
                h2.y as ym
        FROM holes h1
        JOIN holes h2
        ON h1.mirrored_hole_id = h2.id
        ) as all_h
ON hole_id = all_h.id
This query effectively implements the hold ID -> hold ID -> coordinates map described above, first finding the mirrored coordinates associated with each hole.
In the end, we have a table that let's us look up the cartesian coordinates of a hold given only the hold ID.
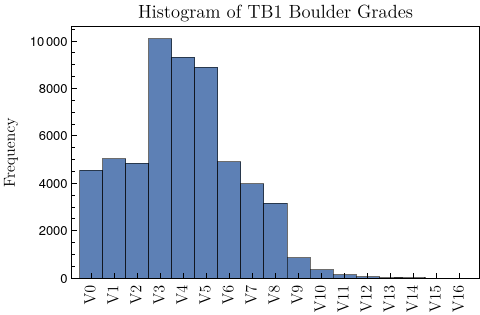
With this data in hand, we now turn towards constructing training, validation, and test sets. First, we note that there is some considerable imbalance in the number of climbs set for each difficulty, as seen in the histogram below.
Additionally, we find that there are often climbs that have the same set of holds, but on walls of different angle. As a result, these climbs have different difficulties associated with them. In order to avoid data leaking into the validation and test sets from the training set, we additionally ensure that climbs that use the same set of holds are all placed within the same data set split. The resulting training, validation, and test sets contain 56,248, 14,015, and 1,782 boulders, respectively, with the training and validation sets sized at a 80:20 ratio.
However, there's still the problem of noise in the data---each boulder is graded by community members, which, as perviously discussed, can be quite unreliable. Fortunately, the TB1 has a set of "benchmark" climbs, which have been designed specifically as representative members of each V grade. Additionally, each one of these benchmark climbs has been climbed at least hundreds of times, suggesting that the given grades are as accurate as they can be. The goal of this project is to train the model to predict the "real" grade of a given boulder, so we use these benchmark problems as the test set. In doing so, we ensure that there is as little noise in the test set as possible, resulting in noise-free measurements of the model's out-of-sample performance. Benchmark climbs are identified by their IDs, which are extracted (along with the wall angle and V grade as described above) using the following SQL query:
SELECT climb_uuid, angle, v_scale.v_grade
FROM climb_stats
        JOIN (
                SELECT
                        difficulty,
                        SUBSTR(boulder_name, INSTR(boulder_name, 'V') + 1, LENGTH(boulder_name)) AS v_grade
                FROM difficulty_grades
                ) as 'v_scale'
        ON ROUND(benchmark_difficulty, 0) = v_scale.difficulty
WHERE benchmark_difficulty IS NOT NULL;
While this approach effectively eliminates noise in the test set, it completely ignores label noise in the training and validation set.
Given the subjectivity and size of the dataset, it's practically impossible to correct these noisy labels.
Instead, we leave them as is---with enough training data and care to prevent over fitting, our model should be able to ignore noisy labels, albeit at the cost of data efficiency.
Ultimately, we wrap the training, validation, and benchmark datasets in a PyTorch DataLoader, which also includes the mirrored version of each climb as a form of data augmentation.
The Model
Given that the holds available for a climb form a set, a natural choice for model architecture is the transformer encoder. This choice has an advantage over convolution-based approaches, in that we can easily encode information about the absolute position of the holds on the wall, rather than just relative location. The absolute position of the holds is important here---holds of various sizes are placed at different points on the wall, so the absolute position of each hold contains information about the hold itself. With our choice in model in hand, we now need to choose how to embed the hold use information, wall angle, and whether matching is allowed, and encode each hold position.Comparing our model against LLMs, arguably the most natural choice for the hold use information is to treat each case (start, middle, end, and foot holds) as members of the "vocabulary". Each of these tokens then gets a learnable embedding into a variable dimension space (we use an embedding_dim of 128 here, which seems to work well). Along similar lines, we'll also embed the matching information as two members of the vocabulary (one for match and the other for no match) which we always include at the start of the input sequence. Each hold location is encoded using a 2D sinusoidal positional encoding, which is added to the embedded representation of each token. We'll encode the angle of the wall as a 1D sinusoidal positional encoding, which is added to the embedding of the match/no match token at the beginning of the sequence. Finally, we'll pad each sequence to a length of 64 tokens, which is long enough to represent all of the boulders in the data set with some room to spare. The resulting encoding allows us to represent each climb in a way that a very traditional transformer encoder architecture can understand.
class TransformerEncoderLayerWithAttention(nn.TransformerEncoderLayer):
    def forward(self, src, src_mask=None, src_key_padding_mask=None, is_causal=False):
        attn_output, attn_output_weights = self.self_attn(src, src, src, attn_mask=src_mask,
                                          key_padding_mask=src_key_padding_mask, is_causal=is_causal,
                                          need_weights=True)
        self.saved_attn = attn_output_weights
        src = src + self.dropout1(attn_output)
        src = self.norm1(src)
        src2 = self.linear2(self.dropout(self.activation(self.linear1(src))))
        src = src + self.dropout2(src2)
        src = self.norm2(src)
        return src
which allows us to extract the attention weights for analysis.
The transformer layer consists of a multi-head self attention mechanism without any masks (we use 2 heads here), followed by a feed forward network (we use a width of 128) with residual connections.
Stacking these layers (we use 4 layers) makes the transformer encoder.
class TransformerEncoderWithAttention(nn.TransformerEncoder):
    def forward(self, src, mask=None, src_key_padding_mask=None, is_causal=False):
        output = src
        self.attn_maps = []
        for mod in self.layers:
            output = mod(output, src_mask=mask, src_key_padding_mask=src_key_padding_mask, is_causal=is_causal)
            self.attn_maps.append(mod.saved_attn.detach().cpu())
        if self.norm is not None:
            output = self.norm(output)
        return output, self.attn_maps
Finally, the entire oridal classification/regression model can be constructed as follows, using the ReLU activation function:
class TransformerClassifier(nn.Module):
    def __init__(self, vocab_size, embedding_dim, num_heads, num_layers, ffw_dim, dropout_rate=0.0):
        super(TransformerClassifier, self).__init__()
        self.embedding_dim = int(embedding_dim)
        self.embedding = nn.Embedding(vocab_size, embedding_dim)
        self.encoder_layer = TransformerEncoderLayerWithAttention(embedding_dim, num_heads, dim_feedforward=ffw_dim, dropout=dropout_rate)
        self.transformer_encoder = TransformerEncoderWithAttention(self.encoder_layer, num_layers, enable_nested_tensor=True)
        self.linear1 = nn.Linear(embedding_dim, embedding_dim)
        self.norm = nn.LayerNorm(embedding_dim)
        self.ReLU = nn.ReLU()
        self.linear2 = nn.Linear(embedding_dim, 1)

    def forward(self, x): #x[batch, climb, embedding]
        embedded = self.embedding(x[:,:,0])
        key_padding_mask = (~(x[:,:,0] > 0))
        for i,e in enumerate(embedded):
            if i == 0:
                embedded[i] += AngleEncoding(self.embedding_dim, x[i,:,1])
            else:
                embedded[i] += PositionalEncoding2d(self.embedding_dim, x[i,:,1], x[i,:,2])
        output, attention_maps = self.transformer_encoder(torch.transpose(embedded,0,1), src_key_padding_mask=key_padding_mask)
        output = self.linear1(output[0, :, :]) # use output of cls token for classification ( or  for match and no match)
        output = self.norm(output)
        output = self.ReLU(output)
        output = self.linear2(output)
        output = self.ReLU(output)
        return output, attention_maps
The prediction head consists of a feedforward network with two layers, which makes a prediction using only the model's embedding of the starting matching token.
A forward pass through this class returns a float estimating the V grade of the input climb.
After training, this float can be rounded to the nearest integer to obtain the predicted V grade of the boulder.
The model is optimized by minimizing the mean square error (MSE) between the prediction and the V grade of the boulder. We optimize with a batch size of 64 using the ADAM optimizer using cosine annealing for 10 epochs, using the best performing model on the validation set as the final model---optimizing the model for longer doesn't seem to improve performance on the validaiton set. Our optimization loop is implemented as follows,
    # Train the model
    for epoch in range(start_epoch + 1, num_epochs + start_epoch + 1):
        n_ran = 0
        train_loss = 0

        for inputs, labels, weights in train_dataloader:
            n_ran += len(inputs)
            optimizer.zero_grad()
            outputs, _ = model(inputs)
            loss = criterion(outputs.t()[0], labels)
            train_loss += loss.detach()
            loss.backward()
            optimizer.step()
            scheduler.step()

        train_loss = train_loss/n_ran*batch_size

	val_loss = 0
        n_ran = 0

        for inputs, labels, weights in val_dataloader:
            n_ran += len(inputs)
            outputs, _ = model(inputs)
            loss = criterion(outputs.t()[0], labels)
            val_loss += loss.detach()

        val_loss = val_loss/n_ran*batch_size
        all_loss.append([train_loss, val_loss])
The model is kept relatively small so that I can train it in a reasonable time on my PC, which doesn't have a GPU.
That being said, the model hyper parameters described above do seem to be somewhat optimal; smaller models have worse performance, while larger models have either comparable or worse performance.
With our model in hand, we can now turn towards testing on the benchmark set!
Results
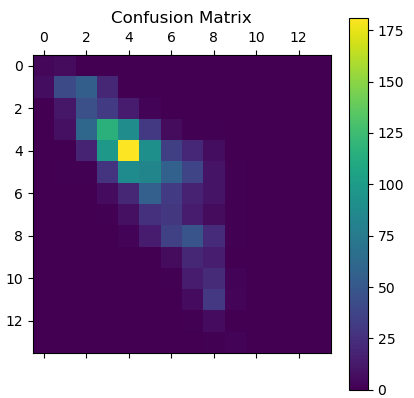
To my knowledge, there have been no studies on how good humans are at predicting the V-grade of boulders. In my experience, the average climber correctly guesses the grade of a climb on the TB1 between $20-30\%$ of the time, and is within one grade of the actual difficulty the majority of the time.We find that our model correctly predicts the difficulty of a given benchmark climb a little over $30\%$ of the time, implying that it is competitive with human performance. On top of that, the model is within one V-grade of the correct difficulty about $73\%$ of the time. The confusion matrix of our model is shown below. On first glance, the model is reasonably accurate for the majority of climbs, but struggles with harder boulders (more than V8 or so). This is likely because harder climbs are relatively rare in our data set. To overcome this, we could look into leveraging methods to counter data set imbalance, or use synthetic data generation methods.
Additionally, as humans, it's often easier to estimate the difficulty of a climb after watching somebody climb it. The TB1 dataset includes video links to people climbing many of the boulders---could this be used to further improve the model?
Check out the GitHub Repo!
Update: public repository hidden at the request of Aurora Climbing Inc.